Chart Examples
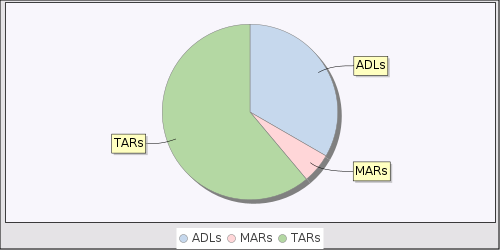 | pieData = new Integer[String];
pieData["MARs"] = 10;
pieData["TARs"] = 110;
pieData["ADLs"] = 60;
url = createChart("pie", pieData); |
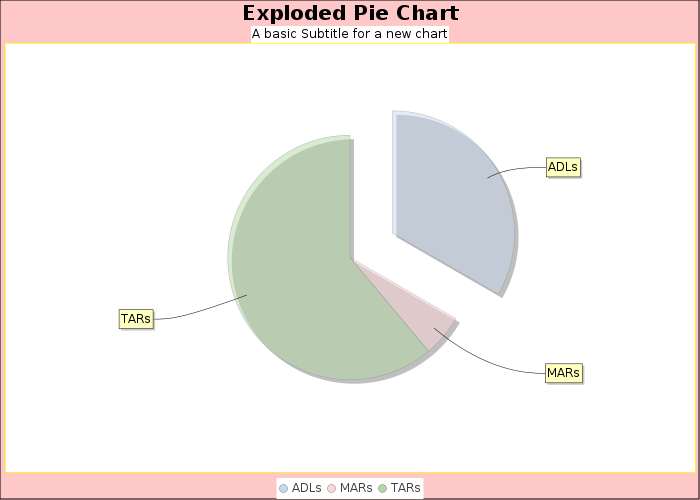 | pieData = new Integer[String];
pieData["MARs"] = 10;
pieData["TARs"] = 110;
pieData["ADLs"] = 60;
optionData = new String[String];
optionData["title"] = "Exploded Pie Chart";
optionData["legend"] = "True";
optionData["toolTips"] = "True";
optionData["URLs"] = "False";
optionData["dataColors"] = "0\n#f00000\n1\n#0000f0\n2\n#00f000";
optionData["explode"] = "ADLs\n0.40";
optionData["3D"] = "False";
optionData["dataAlpha"] = "0.5";
optionData["backgroundColor"] = "#ffffff";
optionData["chartBackgroundColor"] = "255200200";
optionData["chartBorderColor"] = "#000000";
optionData["horzSize"] = "700";
optionData["vertSize"] = "500";
optionData["subtitle1"] = "A basic Subtitle for a new chart";
optionData["outlineColor"] = "#ffff00";
url = createChart("pie", pieData, optionData); |
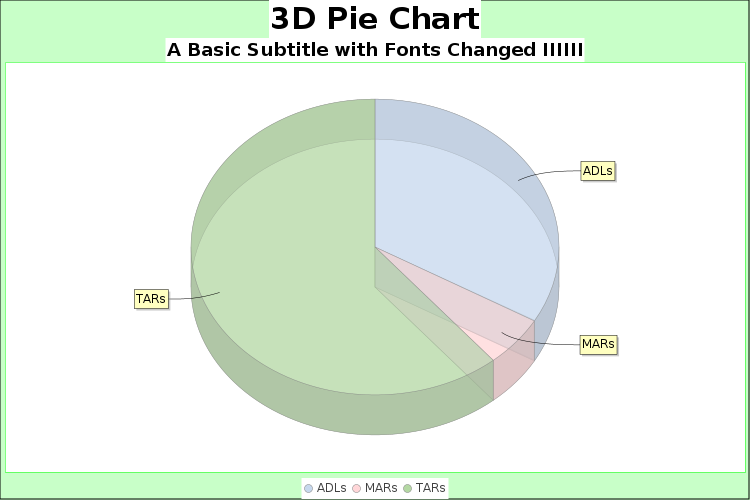 | pieData = new Integer[String];
pieData["MARs"] = 10;
pieData["TARs"] = 110;
pieData["ADLs"] = 60;
pieOptionData = new String[String];
pieOptionData["title"] = "3D Pie Chart";
pieOptionData["legend"] = "True";
pieOptionData["toolTips"] = "True";
pieOptionData["URLs"] = "False";
pieOptionData["dataColors"] = "0\n150250150\n1\n150100000\n2\n000100150";
pieOptionData["3D"] = "True";
pieOptionData["dataAlpha"] = "0.5";
pieOptionData["backgroundColor"] = "255255255";
pieOptionData["chartBackgroundColor"] = "200255200";
pieOptionData["chartBorderColor"] = "000000000";
pieOptionData["horzSize"] = "750";
pieOptionData["vertSize"] = "500";
pieOptionData["subtitle1"] = "A Basic Subtitle with Fonts Changed IIIIII";
pieOptionData["subtitleFont"] = "font-face:Serif,font-weight:Bold,font-size:18";
pieOptionData["titleFont"] = "font-face:SansSerif,font-weight:Bold,font-size:30";
pieOptionData["outlineColor"] = "#00ff00";
url = createChart("pie", pieData, pieOptionData); |
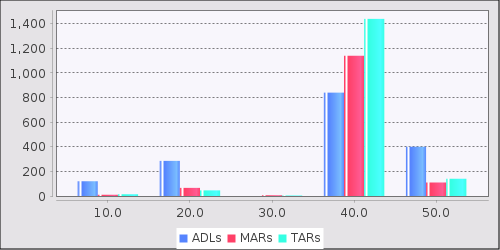 | seriesData1 = new Float[Float];
seriesData2 = new Float[Float];
seriesData3 = new Float[Float];
seriesData1[10.0] = 10.0;
seriesData1[50.0] = 110.0;
seriesData1[20.0] = 66.0;
seriesData1[30.0] = 6.0;
seriesData1[40.0] = 1140.0;
seriesData2[10.0] = 14.0;
seriesData2[50.0] = 140.0;
seriesData2[20.0] = 46.0;
seriesData2[30.0] = 4.0;
seriesData2[40.0] = 1440.0;
seriesData3[10] = 120;
seriesData3[50] = 400;
seriesData3[20] = 286;
seriesData3[30] = 0;
seriesData3[40] = 840;
barData = new Float[String, Float];
barData["MARs"] = seriesData1;
barData["TARs"] = seriesData2;
barData["ADLs"] = seriesData3;
url = createChart("bar", barData); |
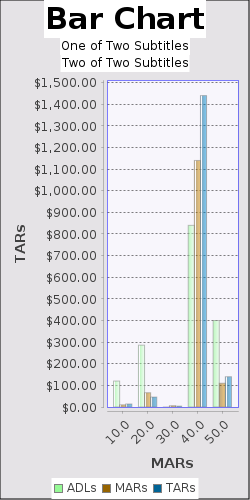 | Continuing from previous example...
barOptionData = new String[String];
barOptionData["categoryLabelRotate"] = "45";
barOptionData["legend"] = "True";
barOptionData["toolTips"] = "True";
barOptionData["URLs"] = "False";
barOptionData["xTitle"] = "MARs";
barOptionData["yTitle"] = "TARs";
barOptionData["title"] = "Bar Chart";
barOptionData["dataAlpha"] = "0.5";
barOptionData["horzSize"] = "250";
barOptionData["vertSize"] = "500";
barOptionData["dataColors"] = "0\n150250150\n1\n150100000\n2\n000100150";
barOptionData["drawBarOutline"] = "True";
barOptionData["itemMargin"] = "0.0";
barOptionData["subtitle1"] = "One of Two Subtitles";
barOptionData["subtitle2"] = "Two of Two Subtitles";
barOptionData["titleFont"] = "font-face:Serif,font-weight:Bold,font-size:30";
barOptionData["outlineColor"] = "#0000ff";
barOptionData["numFormat"] = "Currency";
url = createChart("bar", barData, barOptionData); |
 | Continuing from previous example...
barOptionData["3D"] = "true"
url = createChart("bar", barData, barOptionData); |
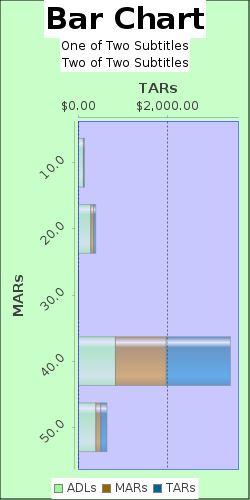 | Continuing from previous example...
barOptionData["backgroundColor"] = "200200255";
barOptionData["chartBackgroundColor"] = "200255200";
barOptionData["chartBorderColor"] = "000000000";
barOptionData["gridLineColor"] = "000000000";
barOptionData["plotOrient"] = "horz";
barOptionData["3D"] = "false";
barOptionData["stacked"] = "true";
url = createChart("bar", barData, barOptionData); |
 | Continuing from previous example...
barOptionData["3D"] = "true"
url = createChart("bar", barData, barOptionData); |
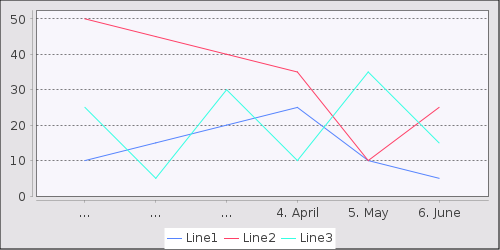 | lineData1 = new Integer[String];
lineData2 = new Integer[String];
lineData3 = new Integer[String];
lineData1["1. January"] = 10;
lineData1["2. February"] = 15;
lineData1["3. March"] = 20;
lineData1["4. April"] = 25;
lineData1["5. May"] = 10;
lineData1["6. June"] = 5;
lineData2["1. January"] = 50;
lineData2["2. February"] = 45;
lineData2["3. March"] = 40;
lineData2["4. April"] = 35;
lineData2["5. May"] = 10;
lineData2["6. June"] = 25;
lineData3["1. January"] = 25;
lineData3["2. February"] = 5;
lineData3["3. March"] = 30;
lineData3["4. April"] = 10;
lineData3["5. May"] = 35;
lineData3["6. June"] = 15;
lineData = new Integer[String, String];
lineData["Line1"] = lineData1;
lineData["Line2"] = lineData2;
lineData["Line3"] = lineData3;
url = createChart("line", lineData); |
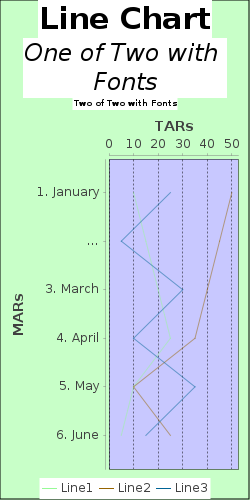 | Continuing from previous example...
lineOptionData = new String[String];
lineOptionData["legend"] = "True";
lineOptionData["toolTips"] = "True";
lineOptionData["URLs"] = "False";
lineOptionData["xTitle"] = "MARs";
lineOptionData["yTitle"] = "TARs";
lineOptionData["title"] = "Line Chart";
lineOptionData["dataAlpha"] = "0.5";
lineOptionData["backgroundColor"] = "200200255";
lineOptionData["chartBackgroundColor"] = "200255200";
lineOptionData["gridLineColor"] = "000000000";
lineOptionData["horzSize"] = "250";
lineOptionData["vertSize"] = "500";
lineOptionData["plotOrient"] = "horz";
lineOptionData["subtitle1"] = "One of Two with Fonts";
lineOptionData["subtitle2"] = "Two of Two with Fonts";
lineOptionData["subtitleFont1"] = "font-face:Serif,font-style:Italic, font-size:24";
lineOptionData["subtitleFont2"] = "font-face:SansSerif, font-weight:Bold,font-size:8";
lineOptionData["seriesShapes"] = "false";
lineOptionData["dataColors"] = "0\n150250150\n1\n150100000\n2\n000100150";
lineOptionData["titleFont"] = "font-face:Serif,font-weight:Bold,font-size:30";
lineOptionData["outlineColor"] = "#000000";
url = createChart("line", lineData, lineOptionData); |
 | yValues1 = new Integer[Integer];
yValues1[0] = 3;
yValues1[1] = 12;
yValues1[2] = 7;
yValues2 = new Integer[Integer];
yValues2[0] = 100;
yValues3 = new Integer[Integer];
yValues3[0] = 33;
yValues3[1] = 20;
yValues4 = new Integer[Integer];
yValues4[0] = 43;
yValues4[1] = 56;
yValues4[2] = 22;
yValues4[3] = 90;
yValues5 = new Integer[Integer];
yValues5[0] = 4;
yValues5[1] = 14;
yValues6 = new Integer[Integer];
yValues6[0] = 29;
yValues7 = new Integer[Integer];
yValues7[0] = 290;
yValues7[1] = 209;
yValues8 = new Integer[Integer];
yValues8[0] = 1090;
yValues8[1] = 1009;
yValues8[2] = 1290;
yValues8[3] = 1209;
yValues9 = new Integer[Integer];
yValues9[0] = 629;
yValues10 = new Integer[Integer];
yValues10[0] = 269;
group1 = new Integer[Integer, Integer];
group1[10] = yValues1;
group1[50] = yValues2;
group1[20] = yValues3;
group1[30] = yValues2;
group1[40] = yValues1;
group2 = new Integer[Integer, Integer];
group2[10] = yValues6;
group2[50] = yValues7;
group2[20] = yValues8;
group2[30] = yValues9;
group2[40] = yValues10;
group3 = new Integer[Integer, Integer];
group3[10] = yValues2;
group3[50] = yValues4;
group3[20] = yValues5;
group3[30] = yValues7;
group3[40] = yValues10;
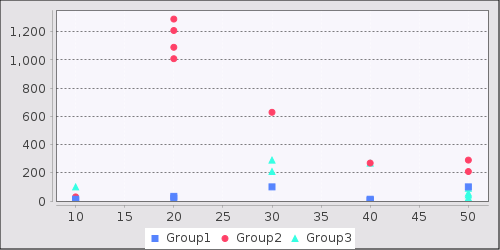
plotInput = new Integer[String, Integer, Integer];
plotInput["Group1"] = group1;
plotInput["Group2"] = group2;
plotInput["Group3"] = group3;
url = createChart("plot", plotInput); |
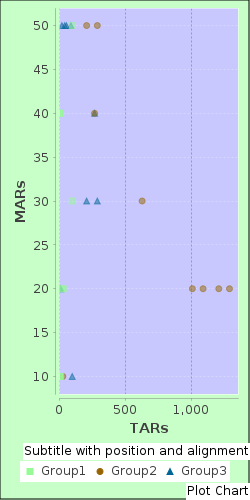 | Continuing from previous example...
plotOptionData = new String[String];
plotOptionData["legend"] = "True";
plotOptionData["toolTips"] = "True";
plotOptionData["URLs"] = "False";
plotOptionData["xTitle"] = "MARs";
plotOptionData["yTitle"] = "TARs";
plotOptionData["title"] = "Plot Chart";
plotOptionData["dataAlpha"] = "0.5";
plotOptionData["backgroundColor"] = "200200255";
plotOptionData["chartBackgroundColor"] = "200255200";
plotOptionData["chartBorderColor"] = "000000000";
plotOptionData["gridLineColor"] = "000000000";
plotOptionData["horzSize"] = "250";
plotOptionData["vertSize"] = "500";
plotOptionData["plotOrient"] = "horz";
plotOptionData["subtitle1"] = "Subtitle with position and alignment";
plotOptionData["subtitleFont1"] = "rotation:bottom,text-align:right,vertical-align:bottom";
plotOptionData["dataColors"] = "0\n150250150\n1\n150100000\n2\n000100150";
plotOptionData["titleFont"] = "rotation:bottom,text-align:right,vertical-align:bottom";
plotOptionData["outlineColor"] = "#ffffff";
url = createChart("plot", plotInput, plotOptionData); |
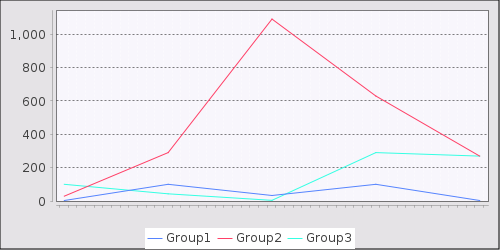
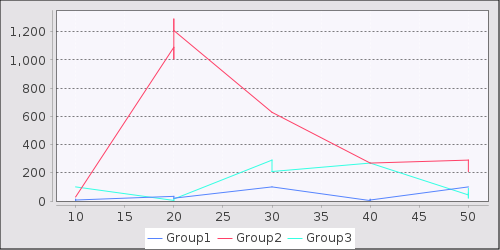 | Continuing from previous example...
url = createChart("xyLine", plotInput); |
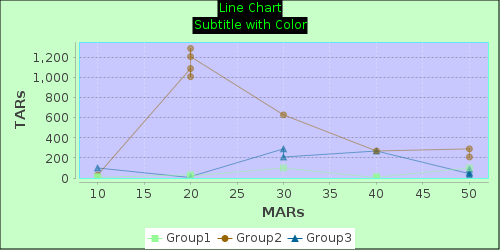 | Continuing from previous example...
xyLineOptionData = new String[String];
xyLineOptionData["legend"] = "True";
xyLineOptionData["toolTips"] = "True";
xyLineOptionData["URLs"] = "False";
xyLineOptionData["xTitle"] = "MARs";
xyLineOptionData["yTitle"] = "TARs";
xyLineOptionData["title"] = "Line Chart";
xyLineOptionData["dataAlpha"] = "0.5";
xyLineOptionData["backgroundColor"] = "200200255";
xyLineOptionData["chartBackgroundColor"] = "200255200";
xyLineOptionData["chartBorderColor"] = "000000000";
xyLineOptionData["gridLineColor"] = "000000000";
xyLineOptionData["horzSize"] = "500";
xyLineOptionData["vertSize"] = "250";
xyLineOptionData["plotOrient"] = "VERTICAL";
xyLineOptionData["subtitle1"] = "Subtitle with Color";
xyLineOptionData["subtitleFont1"] = "background-color:#000000,text-color:#00ff00";
xyLineOptionData["seriesShapes"] = "true";
xyLineOptionData["dataColors"] = "0\n150250150\n1\n150100000\n2\n000100150";
xyLineOptionData["titleFont"] = "background-color:#000000,text-color:#00ff00";
xyLineOptionData["outlineColor"] = "#00ffff";
url = createChart("xyLine", plotInput, xyLineOptionData); |
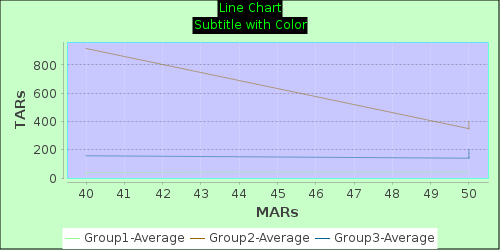 | Continuing from previous example...
xyLineOptionData["movingAvg"] = "true";
xyLineOptionData["period"] = "25.0";
xyLineOptionData["suffix"] = "-Average";
xyLineOptionData["skip"] = "25.0";
xyLineOptionData["seriesShapes"] = "false";
url = createChart("xyLine", plotInput, xyLineOptionData); |
 | date1 = curTime();
date2 = date1.calc("PT1H");
date3 = date1.calc("PT2H");
date4 = date1.calc("PT3H");
date5 = date1.calc("PT4H");
timeGroup1 = new Integer[Time, Integer];
timeGroup1[date1, 0] = 3;
timeGroup1[date2, 0] = 100;
timeGroup1[date3, 0] = 33;
timeGroup1[date4, 0] = 100;
timeGroup1[date5, 0] = 3;
timeGroup2 = new Integer[Time, Integer];
timeGroup2[date1, 0] = 29;
timeGroup2[date2, 0] = 290;
timeGroup2[date3, 0] = 1090;
timeGroup2[date4, 0] = 629;
timeGroup2[date5, 0] = 269;
timeGroup3 = new Integer[Time, Integer];
timeGroup3[date1, 0] = 100;
timeGroup3[date2, 0] = 43;
timeGroup3[date3, 0] = 4;
timeGroup3[date4, 0] = 290;
timeGroup3[date5, 0] = 269;
timeInput = new Integer[String, Time, Integer];
timeInput["Group1"] = timeGroup1;
timeInput["Group2"] = timeGroup2;
timeInput["Group3"] = timeGroup3;
url = createChart("timeLine", timeInput); |
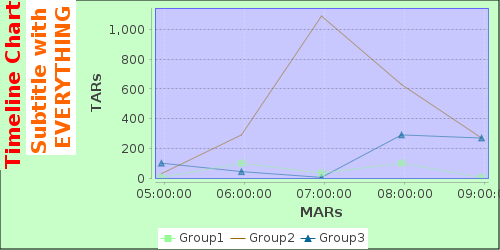 | Continuing from previous example...
timeOptionData = new String[String];
timeOptionData["legend"] = "True";
timeOptionData["toolTips"] = "True";
timeOptionData["URLs"] = "False";
timeOptionData["xTitle"] = "MARs";
timeOptionData["yTitle"] = "TARs";
timeOptionData["title"] = "Timeline Chart";
timeOptionData["dataAlpha"] = "0.5";
timeOptionData["backgroundColor"] = "200200255";
timeOptionData["chartBackgroundColor"] = "200255200";
timeOptionData["gridLineColor"] = "000000000";
timeOptionData["horzSize"] = "500";
timeOptionData["vertSize"] = "250";
timeOptionData["plotOrient"] = "VERTICAL";
timeOptionData["subtitle1"] = "Subtitle with EVERYTHING";
timeOptionData["subtitleFont"] = "font-face:Serif," +
"font-weight:Bold," +
"font-size:20," +
"text-align:left," +
"vertical-align:top," +
"rotation:left," +
"text-color:#ff6600," +
"background-color:#ffffff";
timeOptionData["seriesShapes"] = "0\ntrue\n2\ntrue";
timeOptionData["dataColors"] = "0\n150250150\n1\n150100000\n2\n000100150";
timeOptionData["titleFont"] = "font-face:Serif," +
"font-weight:Bold," +
"font-size:20," +
"text-align:left," +
"vertical-align:top," +
"rotation:left," +
"text-color:#ff0000," +
"background-color:#c7ffc7";
timeOptionData["outlineColor"] = "#0000ff";
timeOptionData["dateFormat"] = "hh:mm:ss";
timeOptionData["dateInterval"] = "\n";
url = createChart("timeLine", timeInput, timeOptionData); |
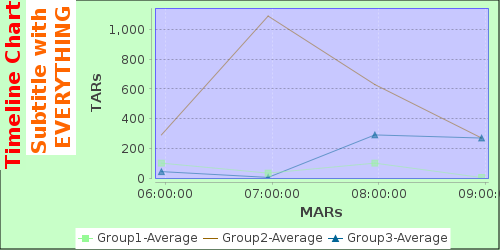 | Continuing from previous example...
timeOptionData["movingAvg"] = "true";
timeOptionData["period"] = "3.0";
timeOptionData["skip"] = "25.0";
timeOptionData["suffix"] = "-Average";
url = createChart("timeLine", timeInput, timeOptionData); |